

OKLAHOMA CITY — The results of a groundbreaking and eye-opening study aimed at visualizing the ways that Oklahoma City’s topography fares under extreme summer heat were released by the city’s Office of Sustainability this month.
The data reveals a picture full of problematic hotspots.
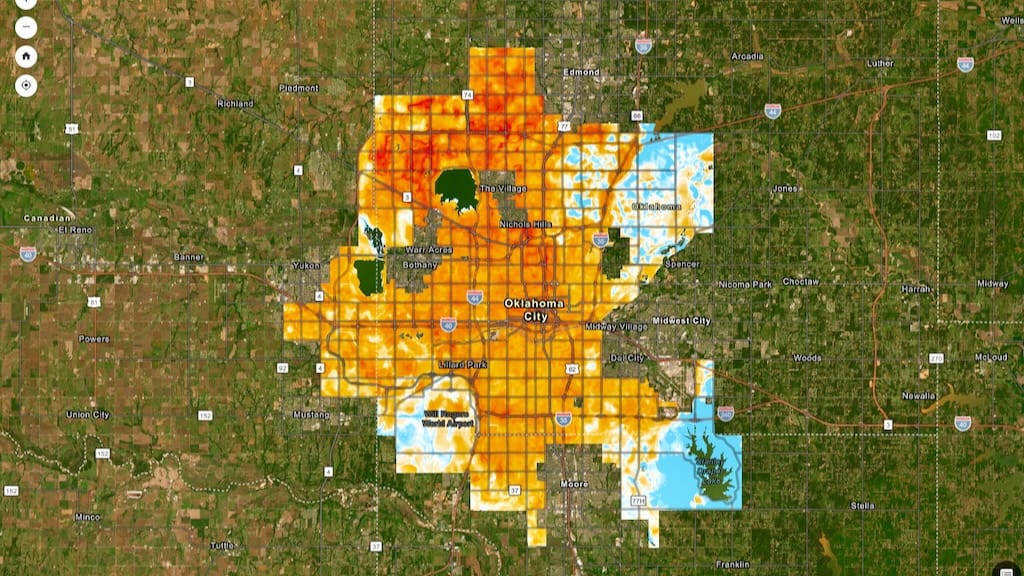
Compiled from citywide data collected over the course of just one day this past summer by a small army of volunteers, the newly released Heat Watch data shows a number of concerning, heat-trapping areas – knows as “urban heat islands” – across the full sprawl of OKC.
With the results of the study now collected and released as part of a nationwide heat-mapping effort organized by climate-focused tech and analytics group named CAPA Strategies, OKC’s Office of Sustainability can begin determining how best to address the city’s hottest hubs and help residents beat the heat.
“There have been a couple of smaller-scale studies done in Oklahoma City before, but this one was particularly unique,” said Sarah Terry-Cobo, Associate Planner for OKC’s Office of Sustainability. “With this study, data was collected at ground level, and that’s a much more accurate sense of how humans are actually experiencing the heat.”
Roving volunteers collect data
The Heat Watch data was collected by a team of 112 volunteers using specially designed instruments fitted to cars to document the exact temperatures at routes and locations all across the city. UPDATE — While the report states that there were 112 volunteers, City of Oklahoma City staff involved directly with the study tell us that it was 252.
The devices were designed and contributed by CAPA Strategies with a generous grant from the National Oceanic and Atmospheric Administration, or NOAA, to make this study possible nationwide.
The OKC project’s selected date of Saturday, August 12, 2023, was carefully chosen after pouring over weather histories going back decades to pinpoint a summer date most likely to see maximal heat and minimal rain.
“We looked at 40 years worth of statistical data that the National Weather Service (NWS) provides, and specifically wanted a weekend so we could get better participation for our volunteers,” said Terry-Cobo. “We could see pretty easily that late-August is when there is typically a lot of hot, dry weather in Oklahoma.”
But of course, true to our state’s reputation of wholly unpredictable weather, the skies didn’t play along. Unexpected cloud cover and the possibility of unforeseen showers plagued the day, threatening to compromise or skew the data to be collected.
“Despite our best efforts, you know, we can’t control the weather,” said Terry-Cobo. “We were in touch with the NWS all day long, and it was even eluding them.”
With a full day of tweaking and a last-minute decision to move the evening’s final run up by an hour to avoid incoming rain, the team was able to collect a day’s worth of heat-mapping data, with over 223,000 individual measurements across OKC and a high of 98 degrees.
Hot spots
The results – all now fully compiled into a comprehensive heat map and publicly available through the Office of Sustainability – show a number of sweltering areas heating far above the average and noticeably trapping and storing the heat long after other city areas saw it disperse and cool.
The locations of the most visible heat islands may come as a surprise to some, however.
The most scorching afternoon temperatures – at times reaching a differential nearly 15 degrees hotter than other areas – were recorded along the Broadway Extension, north of Lake Hefner, and along an area just north of the Kilpatrick Turnpike.
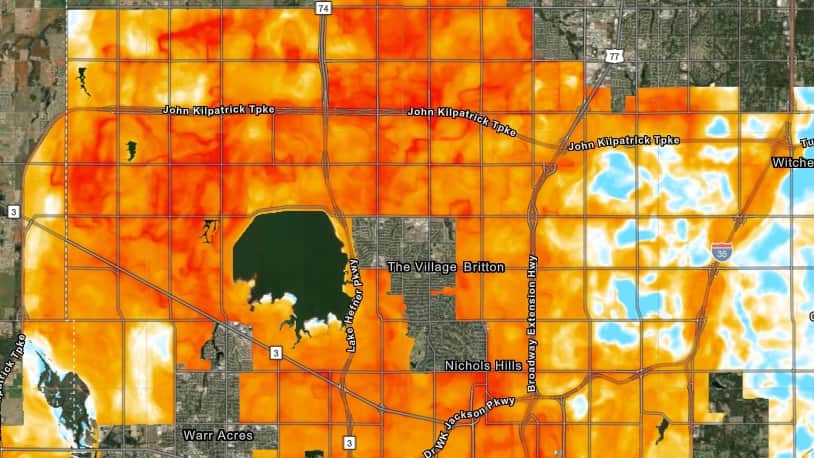
This is likely due to the lack of tree cover and the dominance of impervious structures made of concrete and brick throughout the suburban neighborhoods and business parks in those areas.
“What we see in northwest Oklahoma City, where it’s a bunch of housing developments that are relatively new, is that they have trees, but they’re very young and small right now, so it’s harder for the heat to move around,” Terry-Cobo explained. “Whereas when you have open space, like you would find around Lake Stanley Draper, where some of these older growth forests are intact, is that the heat can move around and dissipate more.”
Burning questions
With the study now completed and compiled into the larger, nationwide picture of similar studies conducted throughout America, the focus turns to questions of how these heat islands might be addressed, and more pressingly, what risks and dangers might the city’s hottest areas pose to our most vulnerable residents.
“There is an important air quality component that is related to heat, really how heat affects air quality” said Terry-Cobo. “Cars put off a lot of heat, you know, and that additional heat and lack of wind and air stagnation leads to worse air quality.”
Continuing studies are currently taking place to examine city air quality, as well as steps to consider inner-city heat experiences and safety measures for those least-equipped to escape the heat.
Speaking with Homeless Alliance Executive Director Dan Straughan illustrates the concern.
“Numbers wise,” he told Free Press earlier this year, “multiple days of excessive heat are more deadly to the homeless population than freezing weather.”
To those ends, the city’s Office of Sustainability is collecting this data to develop recommendations and potential steps for the city with their adaptOKC plan.
“Managing the tree canopy and planting more trees is important,” said Terry-Cobo. “But there [are] other things we can do with the built environment as well. We’ve talked about parking requirements a lot, and we’re looking at the city’s landscaping code right now.”
Currently, parking lots comprise up to 4% of Oklahoma City’s land area, contributing heavily to the largely unshaded, heat-trapping environments visible on the Heat Watch maps.
“We’ve got an urban heat island because of the way that this city has developed over a half-century,” said Terry-Cobo. “That’s going to take a large solution with a lot of partners.”
Take a Look
The full results of the study, as well as the Oklahoma City Office of Sustainability’s further work and research on heat, can be viewed by visiting okc.gov/sustainability and clicking on “Extreme Heat” in the sidebar or follow THIS DIRECT LINK.
Find out about future volunteer opportunities for studies like this one by signing up for their Volunteer Newsletter.

Brett Fieldcamp is the owner and Editor in Chief of Oklahoma City Free Press. He has been covering arts, entertainment, news, housing, and culture in Oklahoma for nearly two decades and served as Arts & Entertainment Editor before purchasing the company from founder Brett Dickerson in 2026.
He is also a musician and songwriter and holds a certification as Specialist of Spirits from The Society of Wine Educators.


